
“Three days to enter data, five days to answer queries.”
The rule couldn’t be any clearer. You’ve told your sites at the IM and reminded them in each newsletter. You know you won’t get 100% compliance, and that’s fine. You’re reasonable.
But this is getting out of control.
As a data manager, you’ll always live with missing forms, blank fields and open queries. It’s a chronic condition that gives rise to acute episodes around interim and final locks. You’ve learned to manage it, even thrive with it, but you know there’s got to be a more effective treatment regimen.
Good news. While there’s no panacea, I’d like to offer a tool you can begin using today, regardless of your systems or processes, to spur your sites onto improved data entry, query resolution, and even enrollment. But as with any treatment, we need to consider directions, precautions and potential side effects.
First, though, some background. If you use EDC and IxRS to facilitate data collection and enrollment, you’ve probably made it a habit to pull their stable of available reports at some regular interval. (If not — if you’re relying solely on the summary statistics and visualizations available on these systems’ dashboards — consider getting acquainted with the detailed exports. This post will explain why.) These reports are almost always available in some Excel-readable format. Chances are you’ve become practiced at applying some formulas to the data inside. (If not, here’s a tutorial on getting started.) The calculations you make are vital in assessing which sites are leading the pack in subject recruitment and data management tasks, including the timely entry of data or resolution of queries. You and your fellow study leaders depend on this information to refine projections, meet lock deadlines, and offer assistance to those sites behind the curve on key operational metrics. But do you share this information with sites?
Yes! As interim locks approach, I always email out the number of total open queries and missing forms, along with encouragement to tidy these issues up. If that’s your response, you’ve already adopted a best practice. But there’s more you can do.
Provided you do so with the right context and tone, you can and in many cases should communicate to each site exactly how they compare to their peers on several key metrics, from average open query age to subjects screened per month. When you supply this information, you recognize the site’s invaluable contributions, feed their natural and justified curiosity, and tap their desire to maximize their performance.
This practice involves three major challenges. The first challenge is calculating useful, “apples-to-apples,” site metrics from the raw data found in your EDC and IxRS reports. The second is distributing this information to each site in a systematic way. The third is couching this information in a message that conveys gratitude and support. But each can be met.
Making the calculations
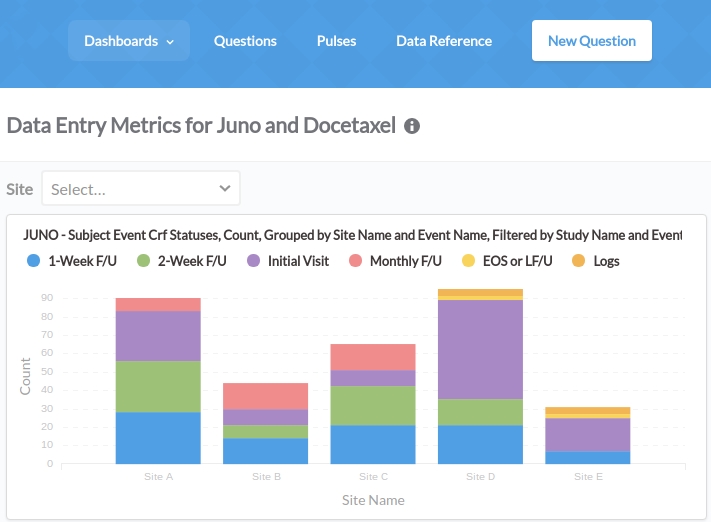 Here, I can offer some great news for users of OpenClinica, and a valuable tool for everyone. OpenClinica now supports a suite of configurable reporting dashboards, providing data managers and those they authorize (including sites) with clear, real-time visualizations of their study data. If you’re currently using OpenClinica, contact us and we’ll gladly share more details.
To help you get started now, regardless of your EDC or IxRS, we’ve created a workbook that performs dozens of calculations for each of your sites based on reports common to nearly every system. It’s free, and guides you step-by-step through converting raw exports into powerful analytics.

Distributing the information
Once you’ve created a table of performance metrics by site, you have the beginnings of a “mail merge.” You simply need to add a column specifying the email address of the individual responsible for data entry for each site.

The steps for executing a mail merge differ from email client to email client. However, some starter documentation is available here:
- Microsoft knowledge article: Use mail merge to send bulk email messages
- Lynda.com video on mail merge in Outlook
- Digital Inspiration: How to Send Personalized Emails with Mail Merge in Gmail
- Mashable: How to send personalized mass emails in Gmail
Setting the context
So far, we’ve touched on the technology of quantitative performance reporting. But what about the art? It’s crucial that sites understand that your intent isn’t to chastise, but to inform and encourage. The metrics you calculate are just one piece of a broader discussion, which would include particularities that simply aren’t reflected in a spreadsheet, such as patient availability and staff experience. A site whose “screened per month” measure ranks in the bottom quartile may have had to overcome incredible hurdles to enroll their six or seven subjects. Meanwhile, they may be adding valuable thought leadership.
To establish the right tone, you might consider adopting a message template like this one:
Hello Site <>,
The Data Safety Monitoring Committee will meet two weeks from today, so it’s important we enter all data for visits that occurred on or before March 31st by this Friday, and close all queries by next Wednesday. We can’t thank you enough for your diligence in screening qualified patients and entering data. As you well know, your efforts here support not just our study, but the patients themselves.
It’s been an incredibly busy month, and we recognize it’s not always possible to enter data within five days of events. We realize some queries take weeks to close. And we know your first priority remains and should remain your patients, whether they’re participating in this study or not. Your accomplishments are all the more impressive in light of these facts.
We believe you deserve insight into the contributions you’re making to our study. That’s why we’re initiating a weekly, custom report to share your site’s progress with you. We understand you may be curious about how your “numbers” stack up against those of those of other sites, so we’ve included some comparative measures in this report. Also, to help you navigate data management, we’ve listed out your missing forms and open queries as of the report date shown. (Please note that you may have closed one or more queries or submitted one or more forms in time between report generation and your receipt of this email. The numbers below are not real-time.)
Thank you again for all you do in service to our study and your patients!
Site <<>> By the Numbers
Report date: <<>>
Screened : << screened>>
Failed : << failed>>
Randomized : << rand>>
SF Rate (Failed / Failed + Randomized) : << sfrate>>
Months Activated : << mons>>
Screened/Month : << srate>>
Screen Rate Country Rank : << srankc>>
Screen Rate Global Rank : << srankg>>
Randomized/Month : << rrate>>
Randomization Rate Country Rank : << rrankc>>
Randomization Rate Global Rank : << rrankg>>
Days Since Last Screening : << dsls>>
Days Since Last Randomization : << dslr>>
Open Queries : << oq>>
Queries Per Subj Screened : << qrate>>
Queries/Subject Country Rank : << qrankc>>
Queries/Subject Global Rank : << qrankg>>
Average Age of Open Queries : << avgqage>>
Age of Oldest Query (Days) : << oldestq>>
Query List : << qlist>>
Missing Pages : << mpgs>>
Missing Pages Per Subject Screened : << mrate>>
Missing Pgs Per Subject Country Rank : << mrankc>>
Missing Pgs Per Subject Global Rank : << mrankg>>
Average Age of Missing Pages (Days) : << avgmpgage>>
Age of Oldest Missing Page : << oldestmpg>>
Missing Page List : << mpgslist>>
Some final precautions
How often you provide a report like the one above, and what you include in it, are at your discretion. Fast-moving infectious disease trials may warrant a weekly report. Large, endpoint-drive cardiac studies may benefit from just one report per month. Also, carefully consider the cultural differences that exist among sites in various countries. There may be no acceptable way of communicating comparative metrics in some.
There’s power in your metadata. You should consult it frequently on your own, weekly if not daily. You can use the workbook above to do that and nothing more. But we have an obligation to patients worldwide to conduct trials in the most efficient manner compatible with the highest data quality. Bringing some gentle pressure to bear on sites is one method of achieving that. If you adopt some version of the practice described in this post, please let us know your experience.