
On a scale from 1 to 10, with 10 representing utmost importance, how important is a healthy diet to you?
Do you have your answer? If so, I’ve got another question.
Which appeals to you more, a cozy bed or a luxurious meal?
Yeah, me too.
These are hardly clinical questions, but as far as survey items go, they’re instructive examples. The wording for each is clear. The response options are distinct. The structures, a scale and a multiple choice, are familiar. But if we want valid answers to these questions, we’ve got some work to do.
When designing a survey, it’s easy to overlook the effects its format could have on the responses. But those effects are potent sources of bias. In the example above, the first question primes you to think about diet and health. In doing so, it stacks the deck against the “luxurious meal” response in the following question. But the trouble doesn’t end there. Although “bed” and “meal” make for a short list, one of them appears before the other. The primacy effect–the tendency of a respondent to choose the first in a list of possible responses, regardless of question content–puts “luxurious meal” at a further disadvantage.
The good news is that surveyors (and data managers) have tools to mitigate these biases. Modern EDC allows you to systematically vary both question and response option order, either by randomly selecting from a set of all possible permutations, or rotating through a block of permutations one participant at a time. The practice, called counterbalancing, guards against unwanted order effects.
But it isn’t a cure all. Consider the practice of rotating through all permutations of your response options. No matter how a set of response options are ordered, one of them has to be placed first. The primacy effect, then, isn’t so much as diminished as it is distributed among all the response options. To illustrate, suppose we ask the two questions above in alternating order to 1,000 respondents, all of whom responded. In the end, you may discover that 82% of the “bed or meal” respondents chose “bed,” while only 16% of the “meal or bed” respondents chose “bed.” Results like these ought to make you suspicious. If there’s no reason to believe the two cohorts differ (apart from the phrasing of the question posed to them), it’s premature to conclude that the population is split almost evenly along their preferences. The majority of the respondents selected whichever option they encountered first, so it’s much more likely that you’ve confirmed the power of the primacy bias.
The same caveat applies to question order. Imagine that our example survey always posed the “bed or meal” question before the “healthy diet” questions. Regardless of how the respondent answers the first questions, she’s now in a state of mind that could influence her next response. (“Ooh, I love luxurious meals. I guess a healthy diet isn’t that important to me,” or “I need better sleep more than I need a rich entree. I guess I healthy diet is important to me.”) To counterbalance, we might alternate the order in which these questions appear. Still, priming may occur in both orderings.
So how do we know if order effects have influenced our results? (Perhaps the better question is: how do we determine the degree to which order effects have influenced our results?) First, it’s important to know which variant of the survey each respondent answered, where variant refers to a unique order of questions and response options. Our example survey comes in (or should come in) four variants:
- Rate the importance of diet, then choose between meal or bed
- Rate the importance of diet, then choose between bed or meal
- Choose meal or bed, then rate the importance of diet
- Choose bed or meal, then rate the importance of diet
All respondents, then, fall into exactly one of these four “variant cohorts.” Let’s assume further that these cohorts differ only in the survey variant they answered; that our experimenters randomly selected the respondents from the same target population, and administered variant 1 to respondent 1, variant 2 to respondent 2, and so on in a cycle.
If, when comparing these cohorts, we find their aggregate responses diverging significantly from one another, we should suspect that ordering effects have distorted our results. All things being equal, the greater the divergence, the more significant the impact of order effects. Our experimenters were careful in recruiting similar respondents, after all, so the profile of responses from any subset should more or less match the profile of responses from any other subset. If that’s not happening, something other than question content is at play.
Precisely quantifying the impact of order effects is the business of professional statisticians, a noble breed from which the present writer stands apart. But as data managers, we owe it to good science to understand the concepts at play and to stand vigilant against their influence. In the end, the truth may not be balanced. But our instruments for finding it should be.
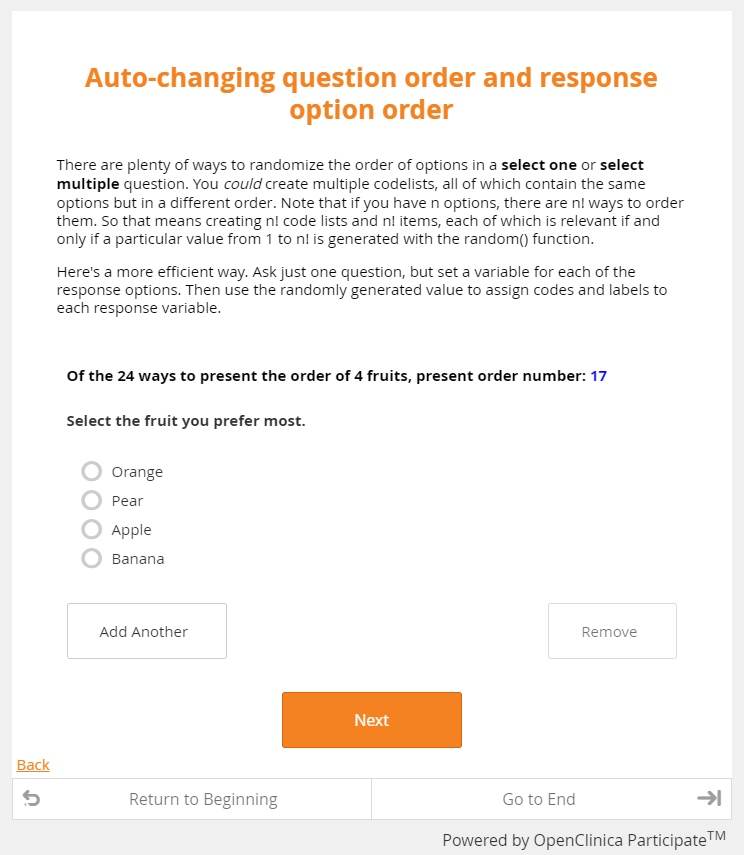
Spotlight on: combinatorics!
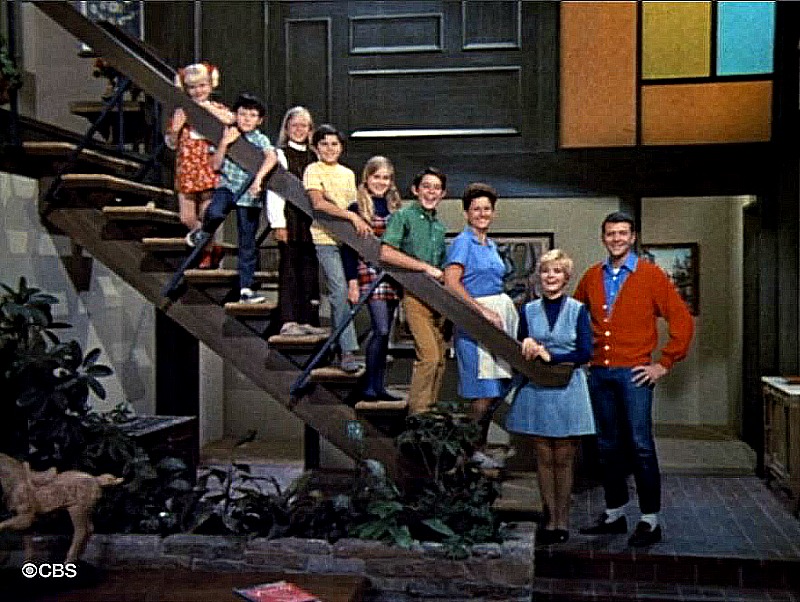
How many ways are there to order n distinct items? Let’s ask the Brady Bunch!
In the photo to above, Cindy stands at the top of the staircase. But it might just as well have been Greg, or Marcia, or even Alice. (She is practically family.) In fact, the director might have chosen any one of the 9 Bradys (or honorary Bradys) to take the top spot. So there are at least 9 ways to arrange this loveable clan. But once the top spot is claimed, we have 8 choices remaining for the next spot. Multiply 9 possibilities for the top spot by 8 possibilities for the second, and we discover that there are at least 72 ways to arrange this brood. But, much like reunion specials and spin-offs, the madness doesn’t end there. We now have to fill the third spot from the 7 remaining Bradys. Multiple the 72 combinations for spots 1 and 2 by the 7 possibilities for spot 3, and we’ve already hit 502 line-ups. Keep going, and you’ll discover that there are 362,880 ways to order one of America’s favorite families alongside one of America’s ugliest staircases.
Of course, you recognize the math here. It’s just 9 factorial. And while n-factorial grows pretty darn fast as n grows, these values pose little to no challenge for computing devices. OpenClinica happens to run on computing devices, so we have no problems with these values either. Combine that performance with our features for generating random numbers (or changing form attributes according to participant order or ID, or both), and you have all the tools you need to implement counterbalancing on any scale.
And that’s much more than a hunch.